Using stata_kernel and Emacs Orgmode for reproducible research goodness
This post is hopefully the last in a series of posts outlining how to use Stata in a proper dynamic document/reproducible research setting using Emacs. As of the summer of 2020, I am only using stata_kernel for my own work and no longer recommend using my customized ob-ipython.el for reasons described here.
This post shows the installation steps to get this working and some usability recommendations if using Org-mode. Before proceeding with anything below, make sure you complete the "Python Preliminaries" steps first.
The following will give you a quick idea of how things work once things are working properly:
Running Stata Commands in Emacs
Once you have setup the python environment following the steps above, do this in emacs:
Install and load emacs-jupyter.el
Ensure that you have activated the python environment where
stata_kernelis availableAdd the following lines to your
init.el:(when (functionp 'module-load) (use-package jupyter) (with-eval-after-load 'org (org-babel-do-load-languages 'org-babel-load-languages '((jupyter . t)))) (with-eval-after-load 'jupyter (define-key jupyter-repl-mode-map (kbd "C-l") #'jupyter-repl-clear-cells) (define-key jupyter-repl-mode-map (kbd "TAB") #'company-complete-common-or-cycle) (define-key jupyter-org-interaction-mode-map (kbd "TAB") #'company-complete-common-or-cycle) (define-key jupyter-repl-interaction-mode-map (kbd "C-c C-r") #'jupyter-eval-line-or-region) (define-key jupyter-repl-interaction-mode-map (kbd "C-c M-r") #'jupyter-repl-restart-kernel) (define-key jupyter-repl-interaction-mode-map (kbd "C-c M-k") #'jupyter-shutdown-kernel) (add-hook 'jupyter-org-interaction-mode-hook (lambda () (company-mode) (setq company-backends '(company-capf)))) (add-hook 'jupyter-repl-mode-hook (lambda () (company-mode) :config (set-face-attribute 'jupyter-repl-input-prompt nil :foreground "black") :config (set-face-attribute 'jupyter-repl-output-prompt nil :foreground "grey") (setq company-backends '(company-capf)))) (setq jupyter-repl-prompt-margin-width 4))) ;; associated jupyter-stata with stata (fixes fontification if using pygmentize for html export) (add-to-list 'org-src-lang-modes '("jupyter-stata" . stata)) (add-to-list 'org-src-lang-modes '("Jupyter-Stata" . stata)) ;; you **may** need this for latex output syntax highlighting ;; (add-to-list 'org-latex-minted-langs '(stata "stata"))
Additionally, remove ("ipython" . "ipython") and ("stata" . "stata") from 'org-babel-load-languages in your init.el (if you have ob-ipython installed).
Usage
Stata code blocks need to look like this:
#+BEGIN_SRC jupyter-stata :session stata :kernel stata
sysuse auto
sum
#+END_SRC
Note the header arguments "jupyter-stata :session stata". The session name (in this case "stata") can be anything you'd like but can't be missing.
Running this code yields both code with syntax highlighting and output:
sum price trunk headroom
(1978 Automobile Data)


    Variable |        Obs        Mean    Std. Dev.       Min        Max
-------------+---------------------------------------------------------
       price |         74    6165.257    2949.496       3291      15906
       trunk |         74    13.75676    4.277404          5         23
    headroom |         74    2.993243    .8459948        1.5          5
Display the first 5 observations using the R-like head magic:
%head 5 if price > 3000| make | price | mpg | rep78 | headroom | trunk | weight | length | turn | displacement | gear_ratio | foreign | |
|---|---|---|---|---|---|---|---|---|---|---|---|---|
| 1 | AMC Concord | 4099 | 22 | 3 | 2.5 | 11 | 2930 | 186 | 40 | 121 | 3.5799999 | Domestic |
| 2 | AMC Pacer | 4749 | 17 | 3 | 3 | 11 | 3350 | 173 | 40 | 258 | 2.53 | Domestic |
| 3 | AMC Spirit | 3799 | 22 | . | 3 | 12 | 2640 | 168 | 35 | 121 | 3.0799999 | Domestic |
| 4 | Buick Century | 4816 | 20 | 3 | 4.5 | 16 | 3250 | 196 | 40 | 196 | 2.9300001 | Domestic |
| 5 | Buick Electra | 7827 | 15 | 4 | 4 | 20 | 4080 | 222 | 43 | 350 | 2.4100001 | Domestic |
Note: In your Org-Mode buffer the above table doesn't display nicely (since by default it returns html). You might want to use the :display text/plain header argument while you are developing your document.
bstrap: regress price mpg headroom trunk(running regress on estimation sample)
Bootstrap replications (50)
----+--- 1 ---+--- 2 ---+--- 3 ---+--- 4 ---+--- 5
.................................................. 50
Linear regression Number of obs = 74
Replications = 50
Wald chi2(2) = 15.48
Prob > chi2 = 0.0004
R-squared = 0.2272
Adj R-squared = 0.2054
Root MSE = 2629.1564
------------------------------------------------------------------------------
| Observed Bootstrap Normal-based
price | Coef. Std. Err. z P>|z| [95% Conf. Interval]
-------------+----------------------------------------------------------------
mpg | -259.1057 67.92036 -3.81 0.000 -392.2271 -125.9842
headroom | -334.0215 318.7159 -1.05 0.295 -958.6932 290.6503
_cons | 12683.31 2209.929 5.74 0.000 8351.933 17014.7
------------------------------------------------------------------------------Displaying and Exporting Graphics
One notable "gotcha" that has always been an issue is that state_kernel uses the console version (on linux) of stata which is fully functional with one exception: ****stata cannot output png files**** when displaying or exporting graphics. stata_kernel sidesteps this by producing svg graphics along with pdf graphics files for each figure displayed in the notebook. This causes some difficulties that vary depending on what we are looking for (showing figures inline in emacs, exporting to html, or exporting to pdf). I gather that these issues aren't relevant for Windows (not sure about MAC).
If we wish to display a histogram of price in the Emacs buffer, we can execute this:
#+BEGIN_SRC jupyter-stata :session stata
hist price
#+END_SRC
(bin=8, start=3291, width=1576.875)
This front-end cannot display the desired image type.While the html export you are viewing above isn't a good result, in the Emacs buffer we will always see a displayed image in buffer:
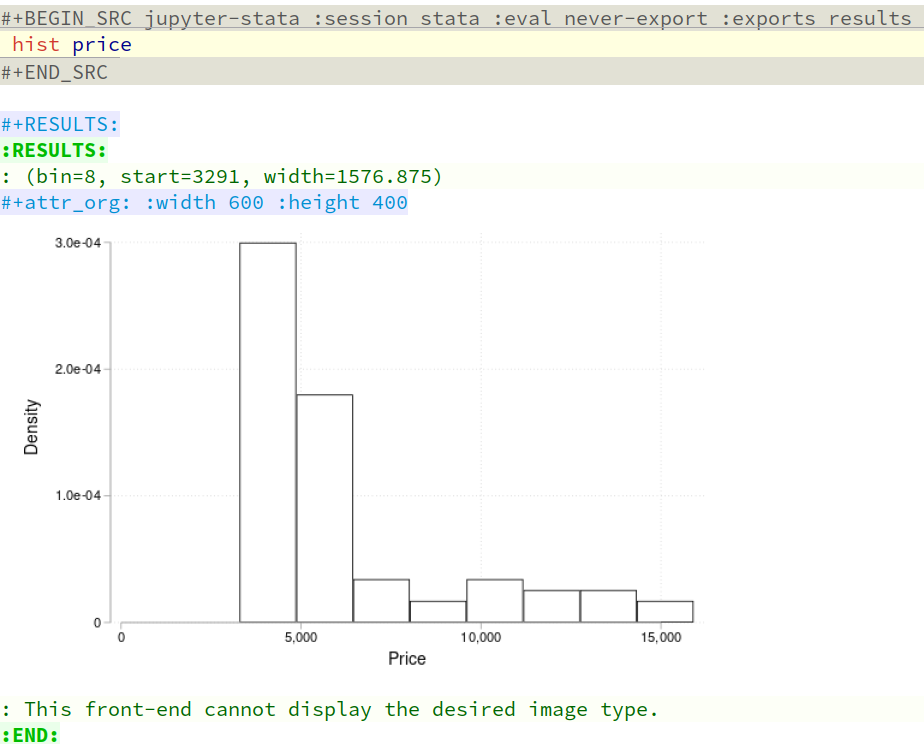
Exporting to html is the primary issue with this method. Additionally, we have the warning message : This front-end cannot display the desired image type. This is because the results are returning a pdf of the image which orgmode can't deal with. We can eliminate this by running the magic
%set graph_svg_redundancy FalseA robust approach for viewing and exporting Graphics
To sidestep this problem and have a more general solution, I suggest the following strategy: continue to use the results from codeblock execution to view figures inside Emacs, but also save them to disk and then reference them manually in orgmode for more robust exporting.
#+BEGIN_SRC jupyter-stata :session :kernel stata :exports code
hist price
graph export "/tmp/hist.svg", replace
#+END_SRC
Then we can manually add a link to this file in our orgmode document via [[/tmp/hist.svg]], to include the histogram in a way that should be robust to whatever document type we wish to export to. It is worth noting that in the Emacs buffer, you will likely see the image twice (one in the results object that we aren't exporting, and one for the manual link you've created). You can turn off the second of these by toggling org-toggle-inline-images.

This method has the added benefit of better/customized placement for figures using org-mode #+attr_html or #+attr_latex directives.
Conclusion
This post shows how to use stata_kernel with Emacs. The method outlined here is superior to one that uses an updated version of ob-stata.el and Emacs Speaks Statistics (ESS) that I wrote about over a year ago as Stata support there has been deprecated for current releases and my modified script no longer works (ie. > Summer 2020). Even the somewhat inconvenient way of dealing with graphical output is no worse than what was required before.